Change any of the text parameters such as
easy_change_text(
  which = .all_theme_els,
  what = .all_element_text,
  to = NULL,
  teach = FALSE
)

.all_theme_els

.all_element_text

easy_all_text_size(size = NULL, teach = FALSE)

easy_all_text_color(color = NULL, teach = FALSE)

easy_all_text_colour(colour = NULL, teach = FALSE)

easy_text_size(which = .all_theme_els, size = NULL, teach = FALSE)

easy_text_color(which = .all_theme_els, color = NULL, teach = FALSE)

easy_text_colour(which = .all_theme_els, colour = NULL, teach = FALSE)

easy_x_axis_title_size(size, teach = FALSE)

easy_y_axis_title_size(size, teach = FALSE)

easy_x_axis_labels_size(size = NULL, teach = FALSE)

easy_y_axis_labels_size(size = NULL, teach = FALSE)

easy_plot_title_size(size = NULL, teach = FALSE)

easy_title_size(size = NULL, teach = FALSE)

easy_plot_subtitle_size(size = NULL, teach = FALSE)

easy_subtitle_size(size = NULL, teach = FALSE)

easy_plot_caption_size(size = NULL, teach = FALSE)

easy_caption_size(size = NULL, teach = FALSE)

easy_plot_legend_size(size = NULL, teach = FALSE)

easy_legend_title_size(size = NULL, teach = FALSE)

easy_plot_legend_title_size(size = NULL, teach = FALSE)

easy_legend_size(size = NULL, teach = FALSE)

easy_center_title(teach = FALSE)

easy_title_bold()

easy_title_regular()

easy_title_plain()
Format
An object of class character of length 15.
An object of class character of length 10.
Arguments
- which
which element to change (see
ggeasy::.all_theme_els)- what
what attribute of the element to change (see
ggeasy::.all_element_text)- to
value to which the attribute should be set
- teach
print longer equivalent
ggplot2expression?- size
size to set attributes to
- color
colo(u)r to set attributes to
- colour
colo(u)r to set attributes to
Examples
library(ggplot2)
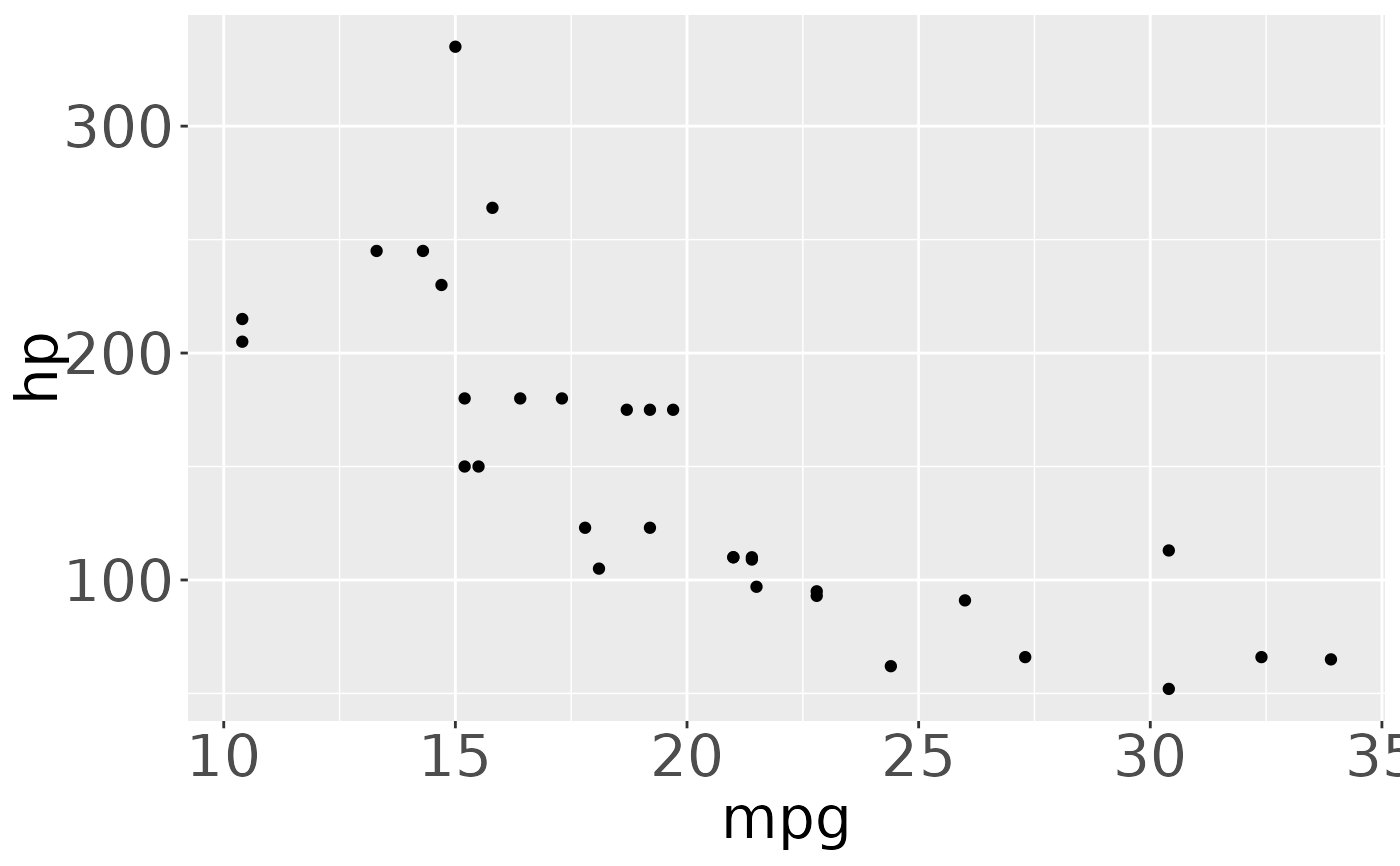
# make all text larger
ggplot(mtcars, aes(mpg, hp)) +
geom_point() +
easy_all_text_size(22)
 # also works if accidentally using easy_text_size(n)
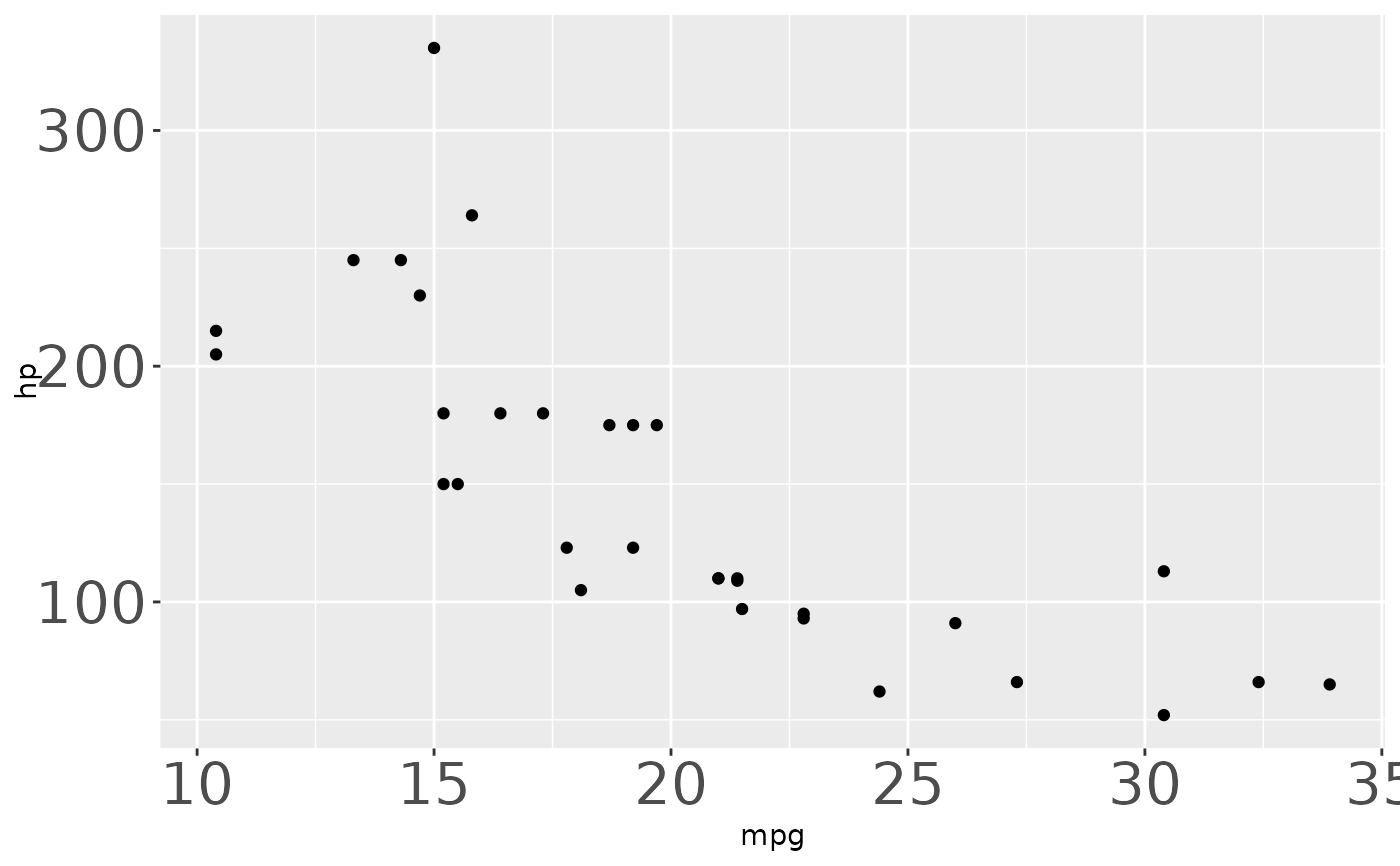
# make the x and y axis text larger
ggplot(mtcars, aes(mpg, hp)) +
geom_point() +
easy_text_size(c("axis.text.x", "axis.text.y"), 22)
# also works if accidentally using easy_text_size(n)
# make the x and y axis text larger
ggplot(mtcars, aes(mpg, hp)) +
geom_point() +
easy_text_size(c("axis.text.x", "axis.text.y"), 22)
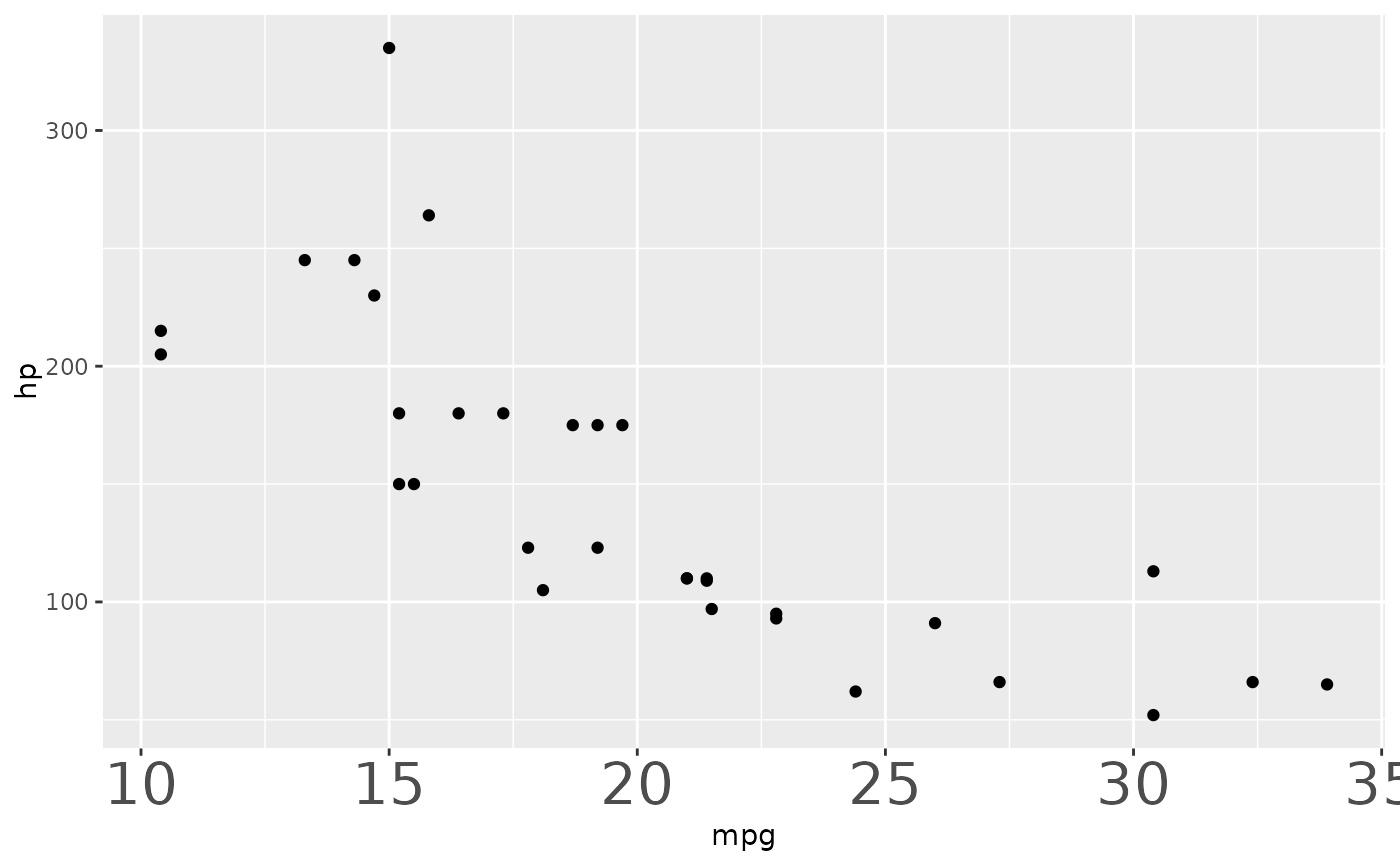
 # make the x axis labels larger
ggplot(mtcars, aes(mpg, hp)) +
geom_point() +
easy_x_axis_labels_size(22)
# make the x axis labels larger
ggplot(mtcars, aes(mpg, hp)) +
geom_point() +
easy_x_axis_labels_size(22)
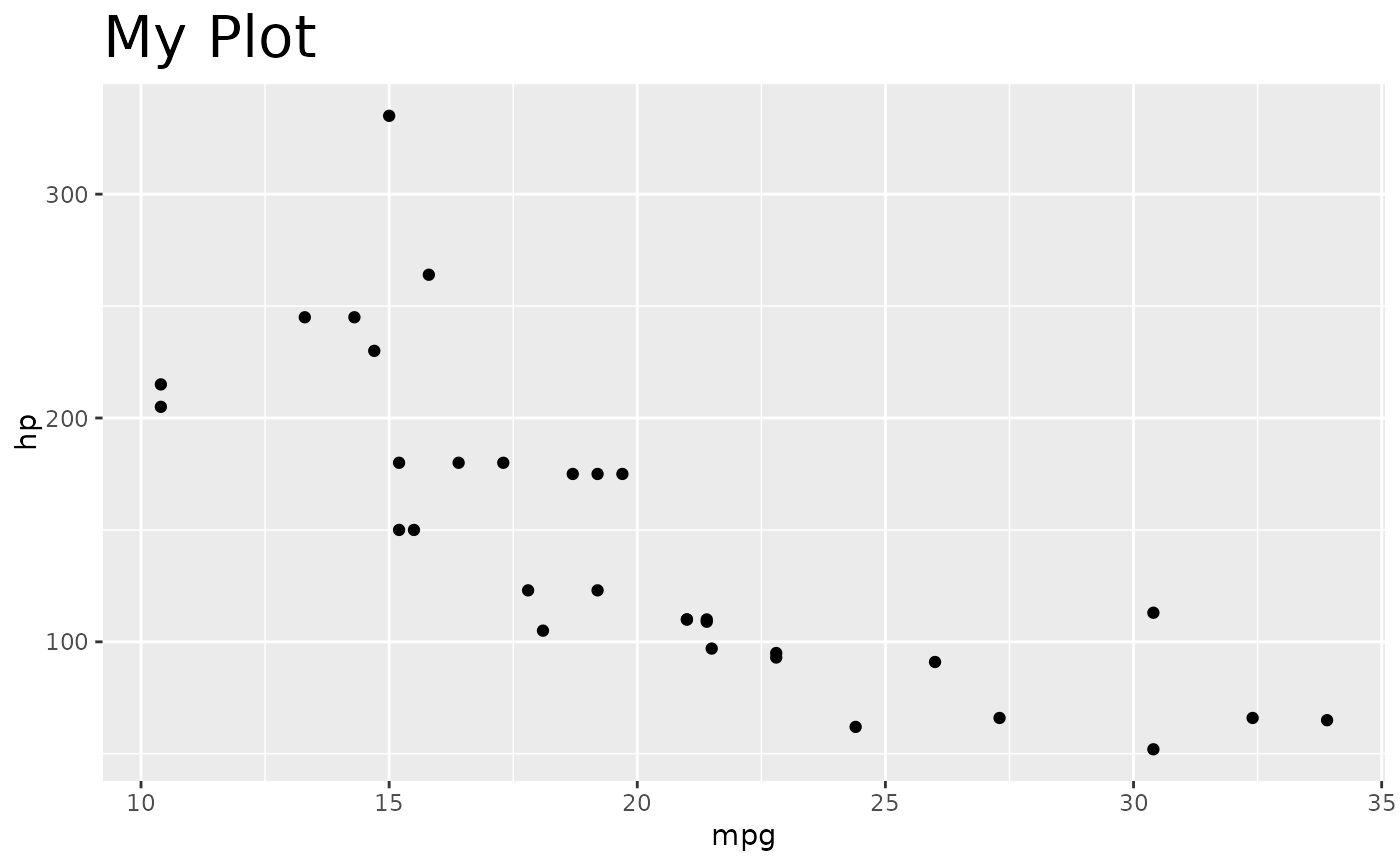
 # make the plot title larger
ggplot(mtcars, aes(mpg, hp)) +
geom_point() +
labs(title = "My Plot") +
easy_plot_title_size(22)
# make the plot title larger
ggplot(mtcars, aes(mpg, hp)) +
geom_point() +
labs(title = "My Plot") +
easy_plot_title_size(22)
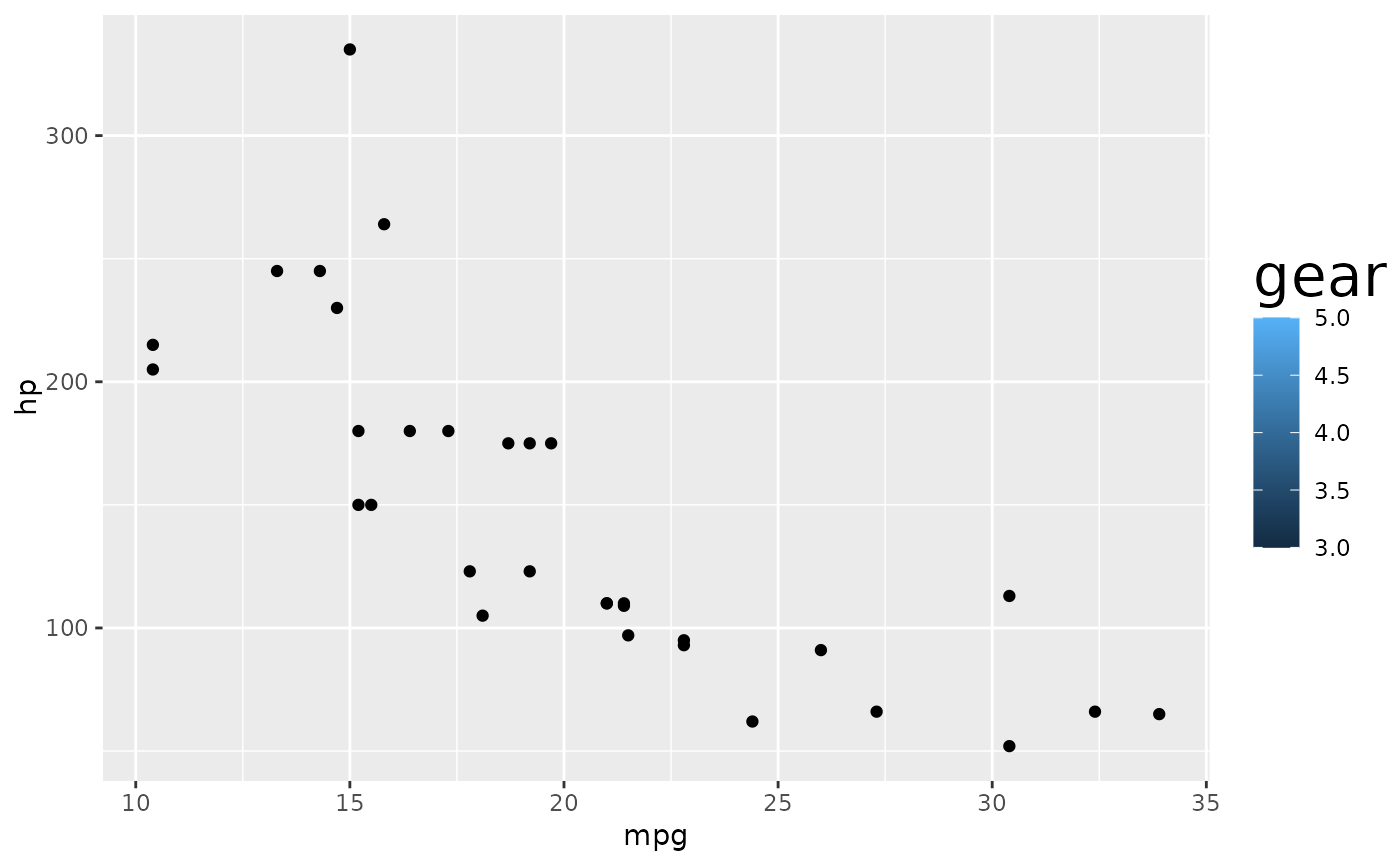
 # make the legend title larger
ggplot(mtcars, aes(mpg, hp)) +
geom_point(aes(fill = gear)) +
easy_plot_legend_title_size(22)
# make the legend title larger
ggplot(mtcars, aes(mpg, hp)) +
geom_point(aes(fill = gear)) +
easy_plot_legend_title_size(22)
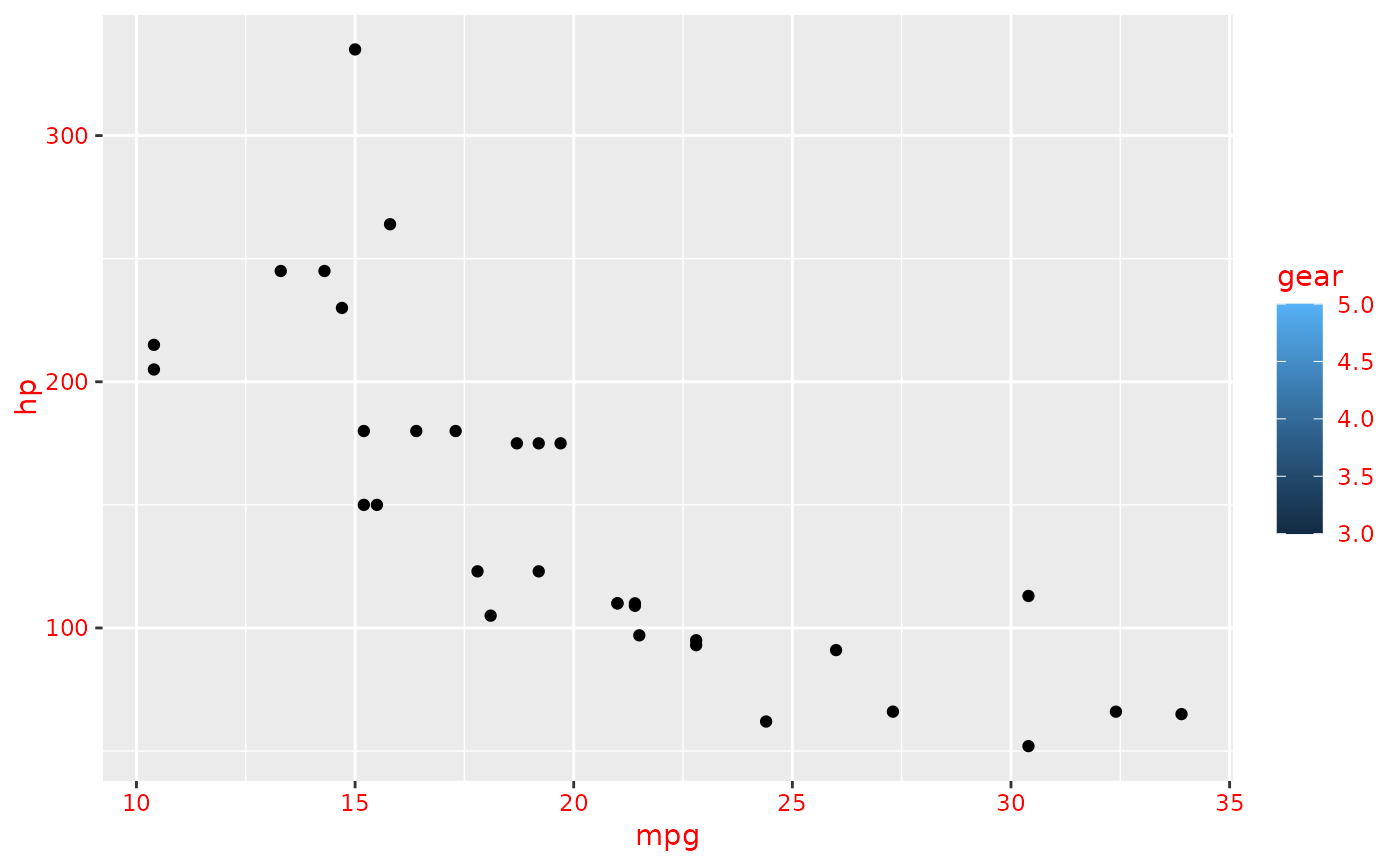
 # make all the text red
ggplot(mtcars, aes(mpg, hp)) +
geom_point(aes(fill = gear)) +
easy_all_text_color("red")
# make all the text red
ggplot(mtcars, aes(mpg, hp)) +
geom_point(aes(fill = gear)) +
easy_all_text_color("red")
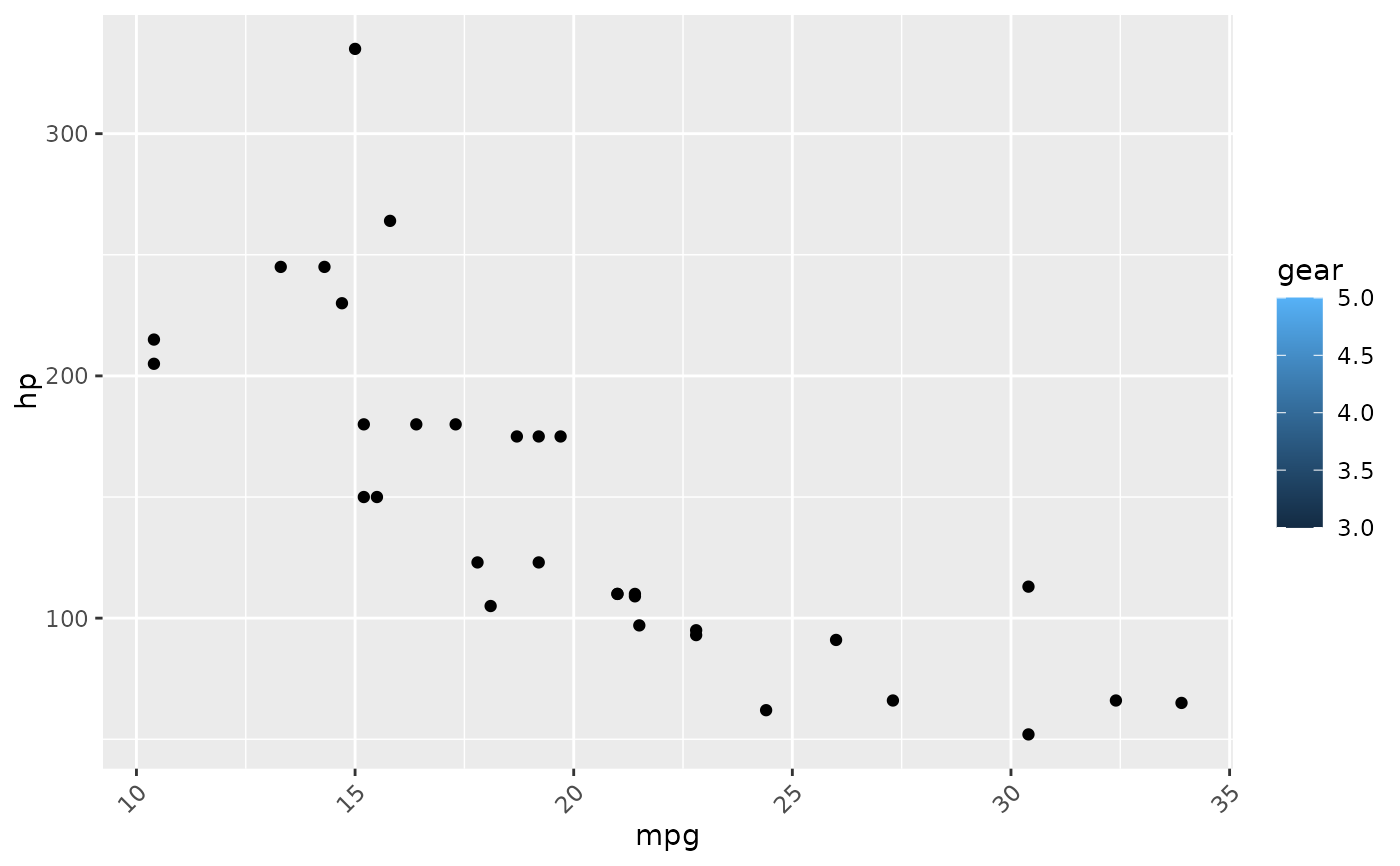
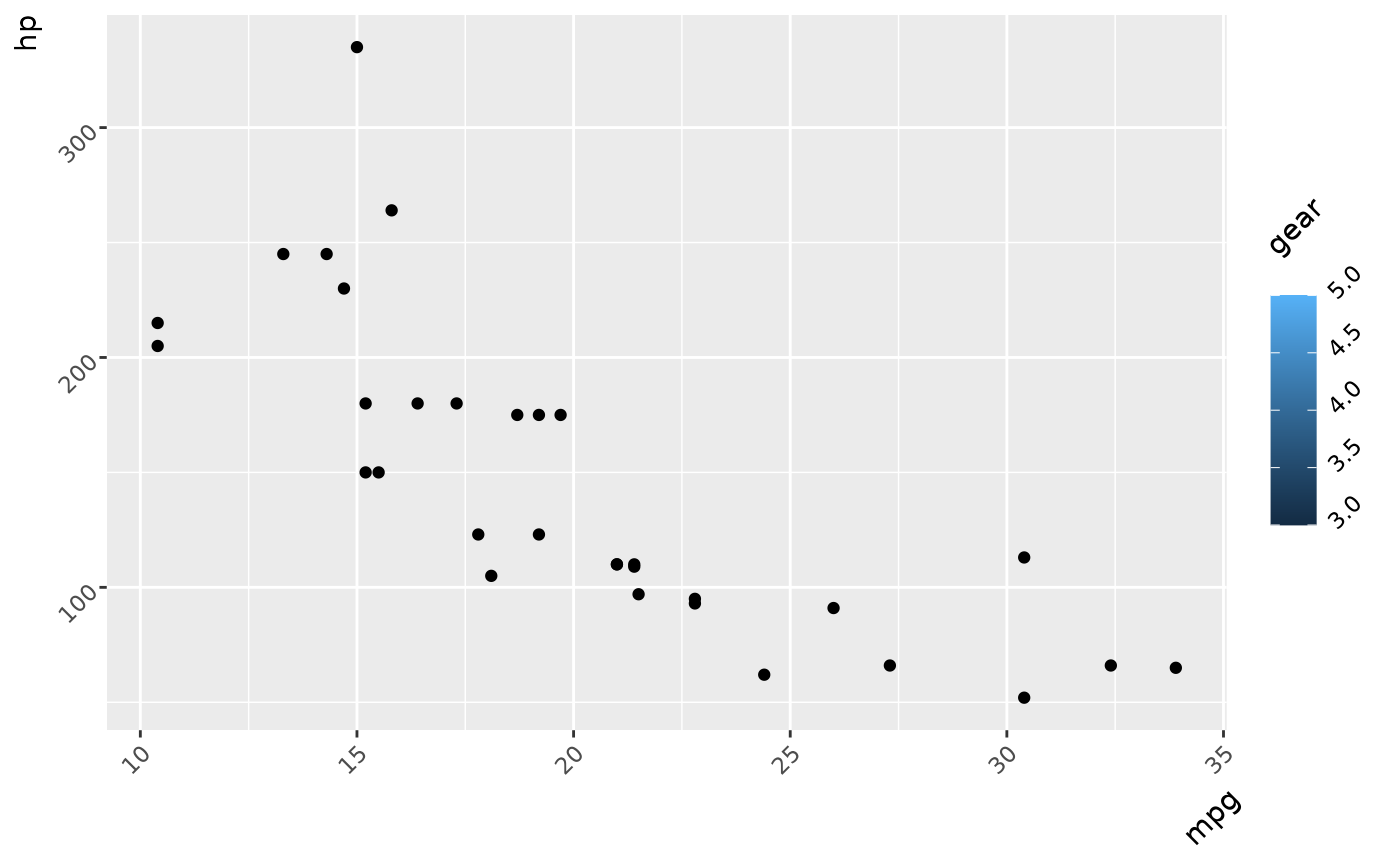
 # make all the text 45 degrees, right-justified
ggplot(mtcars, aes(mpg, hp)) +
geom_point(aes(fill = gear)) +
easy_change_text(what = "angle", to = 45) +
easy_change_text(what = "hjust", to = 1)
# make all the text 45 degrees, right-justified
ggplot(mtcars, aes(mpg, hp)) +
geom_point(aes(fill = gear)) +
easy_change_text(what = "angle", to = 45) +
easy_change_text(what = "hjust", to = 1)
 # make just x-axis text 45 degrees, right-justified
ggplot(mtcars, aes(mpg, hp)) +
geom_point(aes(fill = gear)) +
easy_change_text(which = "axis.text.x", what = "angle", to = 45) +
easy_change_text(which = "axis.text.x", what = "hjust", to = 1)
# make just x-axis text 45 degrees, right-justified
ggplot(mtcars, aes(mpg, hp)) +
geom_point(aes(fill = gear)) +
easy_change_text(which = "axis.text.x", what = "angle", to = 45) +
easy_change_text(which = "axis.text.x", what = "hjust", to = 1)