Introduction
Data science is an exciting discipline that allows you to transform raw data into understanding, insight, and knowledge. The goal of “Haskell for Data Science” is to help you learn the most important tools in Haskell that will allow you to do data science efficiently and reproducibly, and to have some fun along the way 😃. After reading this book, you’ll have the tools to tackle a wide variety of data science challenges using the best parts of Haskell.
What you will learn
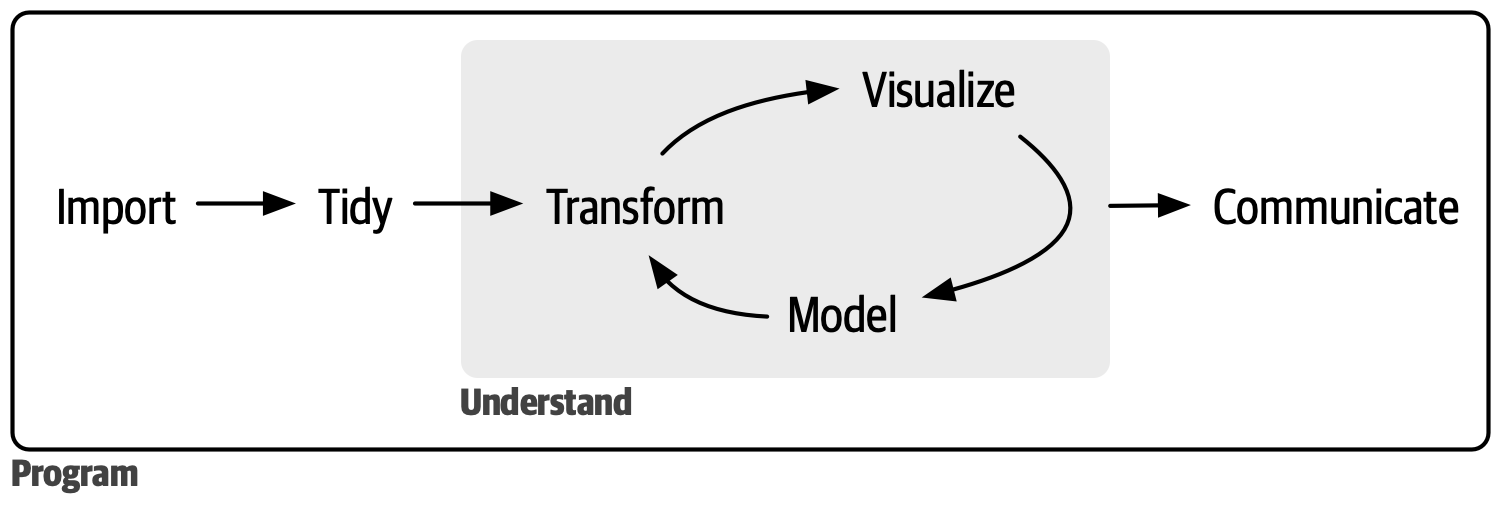
Data science is a vast field, and there’s no way you can master it all by reading a single book. This book aims to give you a solid foundation in the most important tools and enough knowledge to find the resources to learn more when necessary. Our model of the steps of a typical data science project looks something like Figure 1.
First, you must import your data into Haskell. This typically means that you take data stored in a file, database, or web application programming interface (API) and load it into a data frame in Haskell. If you can’t get your data into Haskell, you can’t do data science on it!
Once you’ve imported your data, it is a good idea to tidy it. Tidying your data means storing it in a consistent form that matches the semantics of the dataset with how it is stored. In brief, when your data is tidy, each column is a variable and each row is an observation. Tidy data is important because the consistent structure lets you focus your efforts on answering questions about the data, not fighting to get the data into the right form for different functions.
Once you have tidy data, a common next step is to transform it. Transformation includes narrowing in on observations of interest (like all people in one city or all data from the last year), creating new variables that are functions of existing variables (like computing speed from distance and time), and calculating a set of summary statistics (like counts or means). Together, tidying and transforming are called wrangling because getting your data in a form that’s natural to work with often feels like a fight!
Once you have tidy data with the variables you need, there are two main engines of knowledge generation: visualization and modeling. These have complementary strengths and weaknesses, so any real data analysis will iterate between them many times.
Visualization is a fundamentally human activity. A good visualization will show you things you did not expect or raise new questions about the data. A good visualization might also hint that you’re asking the wrong question or that you need to collect different data. Visualizations can surprise you, but they don’t scale particularly well because they require a human to interpret them.
Models are complementary tools to visualization. Once you have made your questions sufficiently precise, you can use a model to answer them. Models are fundamentally mathematical or computational tools, so they generally scale well. Even when they don’t, it’s usually cheaper to buy more computers than it is to buy more brains! But every model makes assumptions, and by its very nature, a model cannot question its own assumptions. That means a model cannot fundamentally surprise you.
The last step of data science is communication, an absolutely critical part of any data analysis project. It doesn’t matter how well your models and visualization have led you to understand the data unless you can also communicate your results to others.
Surrounding all these tools is programming. Programming is a cross-cutting tool that you use in nearly every part of a data science project. You don’t need to be an expert programmer to be a successful data scientist, but learning more about programming pays off because becoming a better programmer allows you to automate common tasks and solve new problems with greater ease.
You’ll use these tools in every data science project, but they’re not enough for most projects. There’s a rough 80/20 rule at play: you can tackle about 80% of every project using the tools you’ll learn in this book, but you’ll need other tools to tackle the remaining 20%. Throughout this book, we’ll point you to resources where you can learn more.
How this book is organized
The previous description of the tools of data science is organized roughly according to the order in which you use them in an analysis (although, of course, you’ll iterate through them multiple times). In our experience, however, learning data importing and tidying first is suboptimal because, 80% of the time, it’s routine and boring, and the other 20% of the time, it’s weird and frustrating. That’s a bad place to start learning a new subject! Instead, we’ll start with visualization and transformation of data that’s already been imported and tidied. That way, when you ingest and tidy your own data, your motivation will stay high because you know the pain is worth the effort.
Within each chapter, we try to adhere to a consistent pattern: start with some motivating examples so you can see the bigger picture, and then dive into the details. Each section of the book is paired with exercises to help you practice what you’ve learned. Although it can be tempting to skip the exercises, there’s no better way to learn than by practicing on real problems.
What you won’t learn
There are several important topics that this book doesn’t cover. We believe it’s important to stay ruthlessly focused on the essentials so you can get up and running as quickly as possible. That means this book can’t cover every important topic.
Modeling
Modeling is super important for data science, but it’s a big topic, and unfortunately, we just don’t have the space to give it the coverage it deserves here.
Big data
This book proudly and primarily focuses on small, in-memory datasets. This is the right place to start because you can’t tackle big data unless you have experience with small data. The tools you’ll learn throughout the majority of this book will easily handle hundreds of megabytes of data, and with a bit of care, you can typically use them to work with a few gigabytes of data. We’ll also show you how to get data out of databases and parquet files, both of which are often used to store big data. You won’t necessarily be able to work with the entire dataset, but that’s not a problem because you only need a subset or subsample to answer the question that you’re interested in.
Prerequisites
We’ve made a few assumptions about what you already know to get the most out of this book. You should be generally numerically literate, and it’s helpful if you have some basic programming experience already. If you’ve never programmed in Haskell before, you might find Learn You A Haskell For Great Good to be a valuable adjunct to this book.
You need a few things to run the code in this book: GHC, Cabal, and some Haskell packages.
Packages are the fundamental units of reproducible R code. They include reusable functions, documentation that describes how to use them, and sample data.
GHC + Cabal
To download Haskell, use ghcup.
Our core packages
You’ll also need to install some Haskell packages. A Haskell package is a collection of functions, data, and documentation that extends the capabilities of base Haskell. Using packages is key to the successful use of Haskell.
You can install the complete tidyverse with a single line of code:
$ cabal install --lib dataframe text template-haskellOn your computer, type that line of code in the console, and then press enter to run it.
Acknowledgments
This book would not exist without the giants whose shoulders it stands upon—both in the R community where these ideas were popularized and the Haskell community where they have been refined.
First and foremost, my thanks go to Hadley Wickham and Garrett Grolemund. Their work on R for Data Science revolutionized how an entire generation of practitioners thinks about data. By providing a clear, cohesive framework for the “Data Science Cycle,” they created a roadmap that transcends any single programming language. This book is a tribute to that vision.
In the Haskell world, I am deeply indebted to the developers who have worked tirelessly to make “Industrial Haskell” a reality for data practitioners.